As AI tools become more common in SMEs, the biggest challenge is no longer “What tool should we use?”—but “How do we understand, manage, and make decisions using AI?”
This module focuses on the practical skills employees need to work confidently with AI-powered dashboards, insights, and everyday business data.
Rather than looking at technical development, the emphasis here is on human decision-making, interpreting AI-generated insights, and choosing the right actions based on what the data shows.
Learners will explore how AI highlights patterns, flags risks, and supports business decisions—while understanding when human judgement is still essential.
By the end, learners will be able to read AI-assisted dashboards, evaluate AI-generated explanations, and use insights to guide real SME decisions in areas like operations, customer service, marketing, and planning.
By the end of this module, learners should be able to:
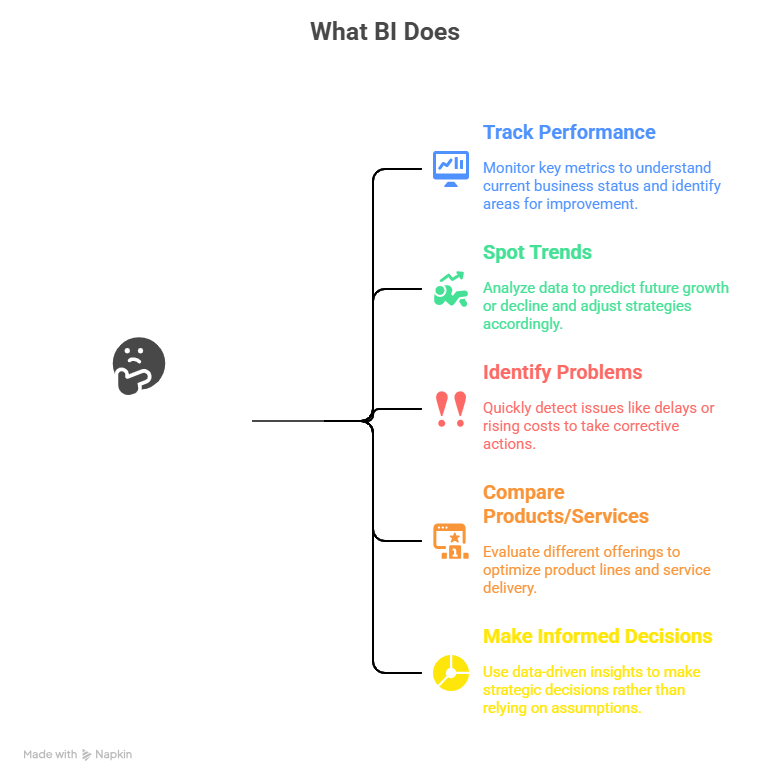
Business Intelligence (BI) refers to the tools, processes, and dashboards that help organisations turn raw data into clear insights.
Instead of looking at scattered spreadsheets or guessing based on intuition, BI tools bring information together in one place so managers can see what’s happening in the business at a glance.
BI tools allow SMEs to:
BI usually appears as an interactive dashboard with:
Even small businesses benefit from BI because it helps them:
Business Intelligence (BI) tools help SMEs turn raw data into meaningful insights. Typical BI tools used by SMEs include:
Modern BI tools now include:
AI Feature | What It Does | SME Benefit |
Forecasting | Predicts future values | Helps prepare stock, labour, or budgets |
Auto-generated insights | Highlights important changes | Saves time scanning large dashboards |
Anomaly detection | Flags unusuals spikes or drops | Early warning for issues |
Summaries & narratives | Converts charts into plain English explanations | Helps non-technical staff |
Example:
Power BI might automatically detect that “June sales are significantly below expected trend” and highlight it with a coloured callout.
Dashboards help SMEs:
According to the OECD D4SME 2024 report, 72% of surveyed SMEs already use digitally gathered and analysed data to support strategic decisions.
For some more introductory knowledge on business intelligence, take a look at this video that introduces some key concepts:
To skip to different sections of the video depending on your initial knowledge, check out the topics and timestamps below:
Dashboards usually include:

AI Feature | What it Looks Like | Example |
Forecast Line | Dotted/coloured extension of trend line | “Predicted sales: +8% next month” |
Auto-Insights | Pop-out boxes with explanations | “AI insight: Local Honey sales 40% above average” |
Anomaly Flags | Highlighted points or icons | “Unusual drop detected” |
Trend Narratives | Small text summaries | “Overall sales are increasing steadily” |
Forecasting:
Useful for planning — but always check if it aligns with reality.
Sales rising for 3 months? Forecast likely reliable.
Sales jumping unpredictably? Forecast may mislead.
Auto-insights:
Help beginners spot patterns — but they don’t explain why the change happened.
Anomaly detection:
Great for catching problems early — but SMEs need to validate root causes.
Category | Traditional BI Tools | AI-Enhanced BI Tools |
Data Preparation | Manual data cleaning and importing (CSV/Excel). | Automated data cleaning, smart suggestions, anomaly detection. |
Dashboard Creation | User builds every chart manually. | AI generates charts or dashboards from natural-language prompts. |
Insights | Static metrics; user interprets patterns themselves. | Automated insights (trends, anomalies, drivers, summaries). |
Forecasting | Basic trend lines, often built manually. | Predictive forecasting using machine learning. |
User Skill Requirements | Requires higher data and technical skills. | Lower skill barrier — plain-language queries (“Which product dipped last month?”). |
Decision Support | User must analyse and decide. | AI suggests actions or flags risks (stockouts, declining segments). |
Speed of Analysis | Slow; dependent on analyst availability. | AI generates insights instantly. |
Maintenance Effort | High maintenance — reports are updated manually. | Lower maintenance — automated refreshes and AI-assisted updates. |
Use Cases | Used mainly for periodic reporting (monthly KPIs). | Used for real-time insights, continuous monitoring, proactive alerts. |
Watch the video below to find out how predictive planning and demand forecasting driven by artificial intelligence is transforming how business operate and deliver better customer experiences:
Modern BI tools increasingly include built-in AI features that help SMEs understand their data without needing specialist skills.
This unit shows how AI-assisted dashboards actually look in practice and how to interpret them.
The goal is to help you recognise useful patterns, spot issues early, and understand how AI supports everyday decision-making.
Dashboards give SMEs a single view of what is happening inside the business.
AI now makes dashboards more powerful by:
For SME teams, this means less time hunting through spreadsheets and more time using insights to take action.
AI does not replace human judgement. Instead, it improves the quality and speed of decisions by pointing users toward what matters.
Strong SME decision-making involves:
Spotting the signal, not the noise
AI highlights important patterns (e.g., declines, spikes, risks). Humans verify context.
Looking beyond single metrics
Good decisions require considering trends, categories, and contributing factors together.
Asking “why” after AI shows “what”
AI tells you what happened — the team must uncover why it happened.
Translating data into action
A chart or AI insight is only useful when it leads to a concrete step (adjust stock, change staffing, investigate supplier).
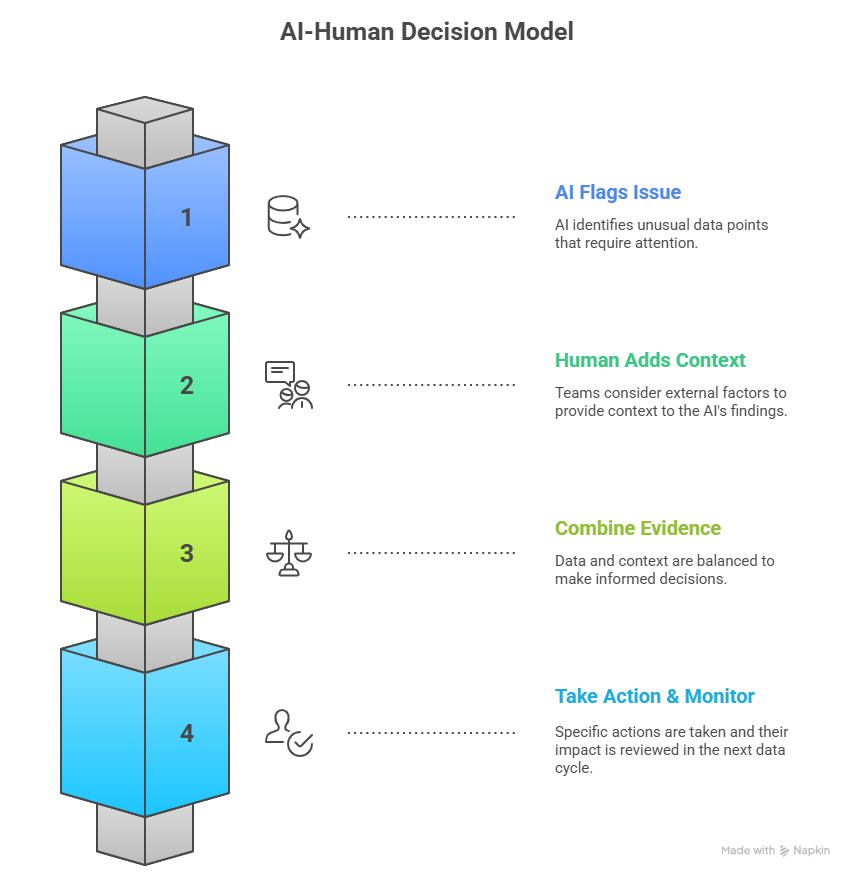
Use this simple framework to make decisions using AI-powered dashboards.
AI surfaces unusual data points:
Teams consider:
This prevents false assumptions.
A good decision balances:
The key is choosing a small, specific action and reviewing next month’s data.
Examples:
AI insights may be unreliable when:
AI Insight:
“Customer visits were 26% higher than expected on Friday.”
Human check:
It was a public holiday in the region.
Decision: Increase staffing on future holiday weekends.
AI Insight:
“Smoothie sales have declined for three consecutive weeks.”
Human check:
Supplier delivered poor-quality fruit → customers ordered less.
Decision: Switch supplier + run a “Fresh Taste” promotion.
AI Insight:
“Facebook ads are generating 42% more clicks than Google Ads.”
Human check:
Clicks don’t equal purchases.
Decision: Check conversion data before increasing spend.
Before acting on an AI-generated insight, ask:
Dive into understanding Business Intelligence, Data Analytics, and Business Analytics. Unravel the distinct roles they play in shaping the past, present, and future of businesses.
Step-by-step beginner guides for dashboards, data modelling, insights, and AI-powered analytics. Free hands-on materials to practise dashboards and AI-assisted BI skills.
https://learn.microsoft.com/power-bi
Annual expert review of major BI tools (e.g., Power BI, Tableau, Qlik).
Helps understand different BI platforms, their strengths, and the role of AI in modern BI dashboards.
https://www.gartner.com/reviews/market/analytics-business-intelligence-platforms
Thousands of real dashboards built by industry professionals, plus free learning modules for beginners. Browse real BI dashboards and learn how to create visual insights.
https://public.tableau.com/app/discover
Regular updates on features like Smart Narratives, AI Insights, Q&A visual, anomaly detection, and Copilot for BI. See how modern BI tools integrate AI and what skills are needed to use them.

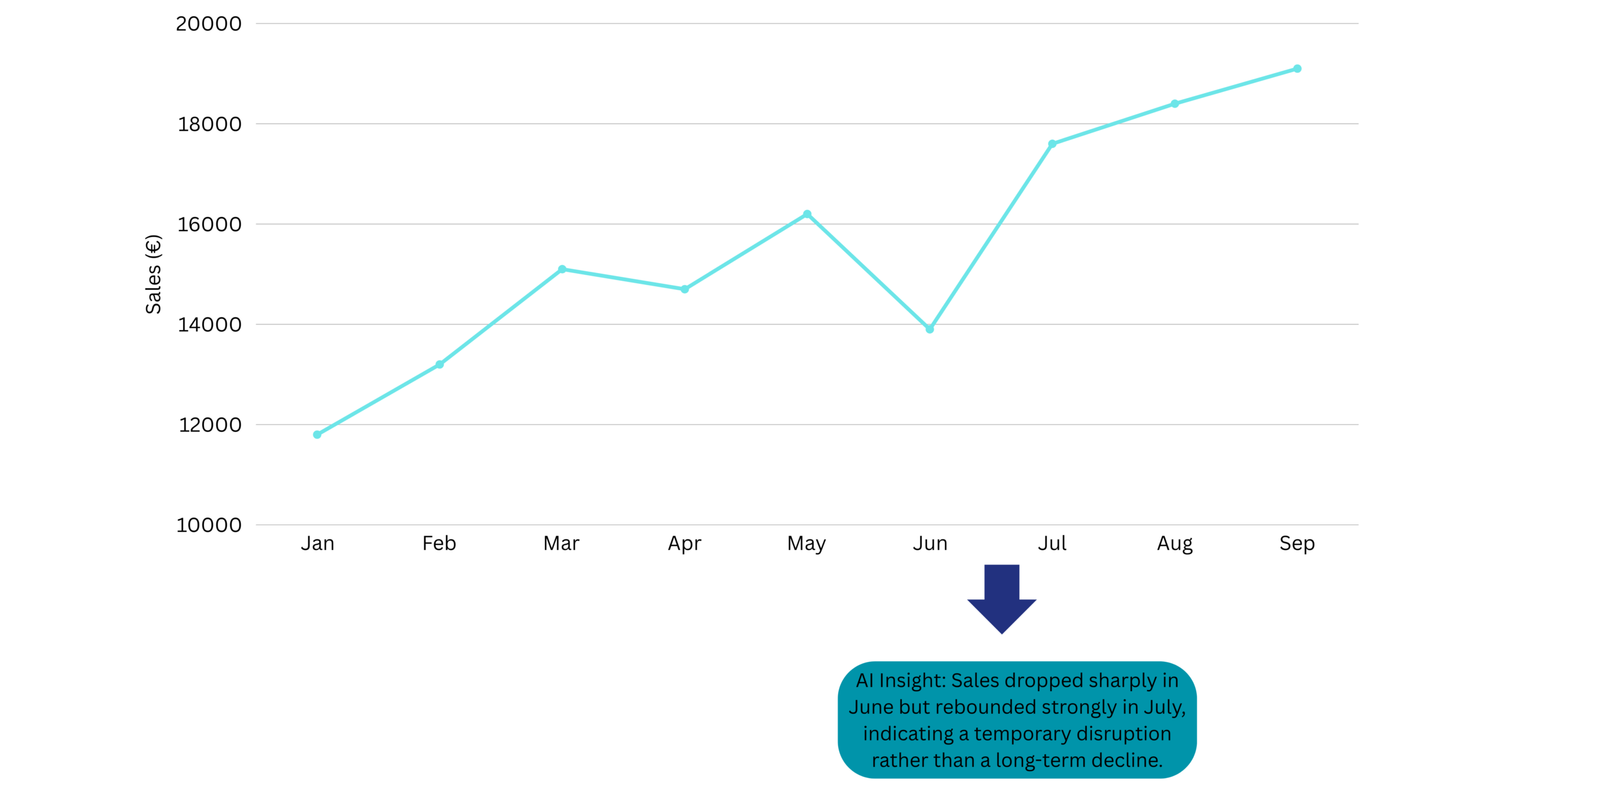
This is a line chart, which can help staff understand performance over time. AI systems can automatically flag:
Look at the graph and the AI Insight box, then answer the questions below in a notebook:
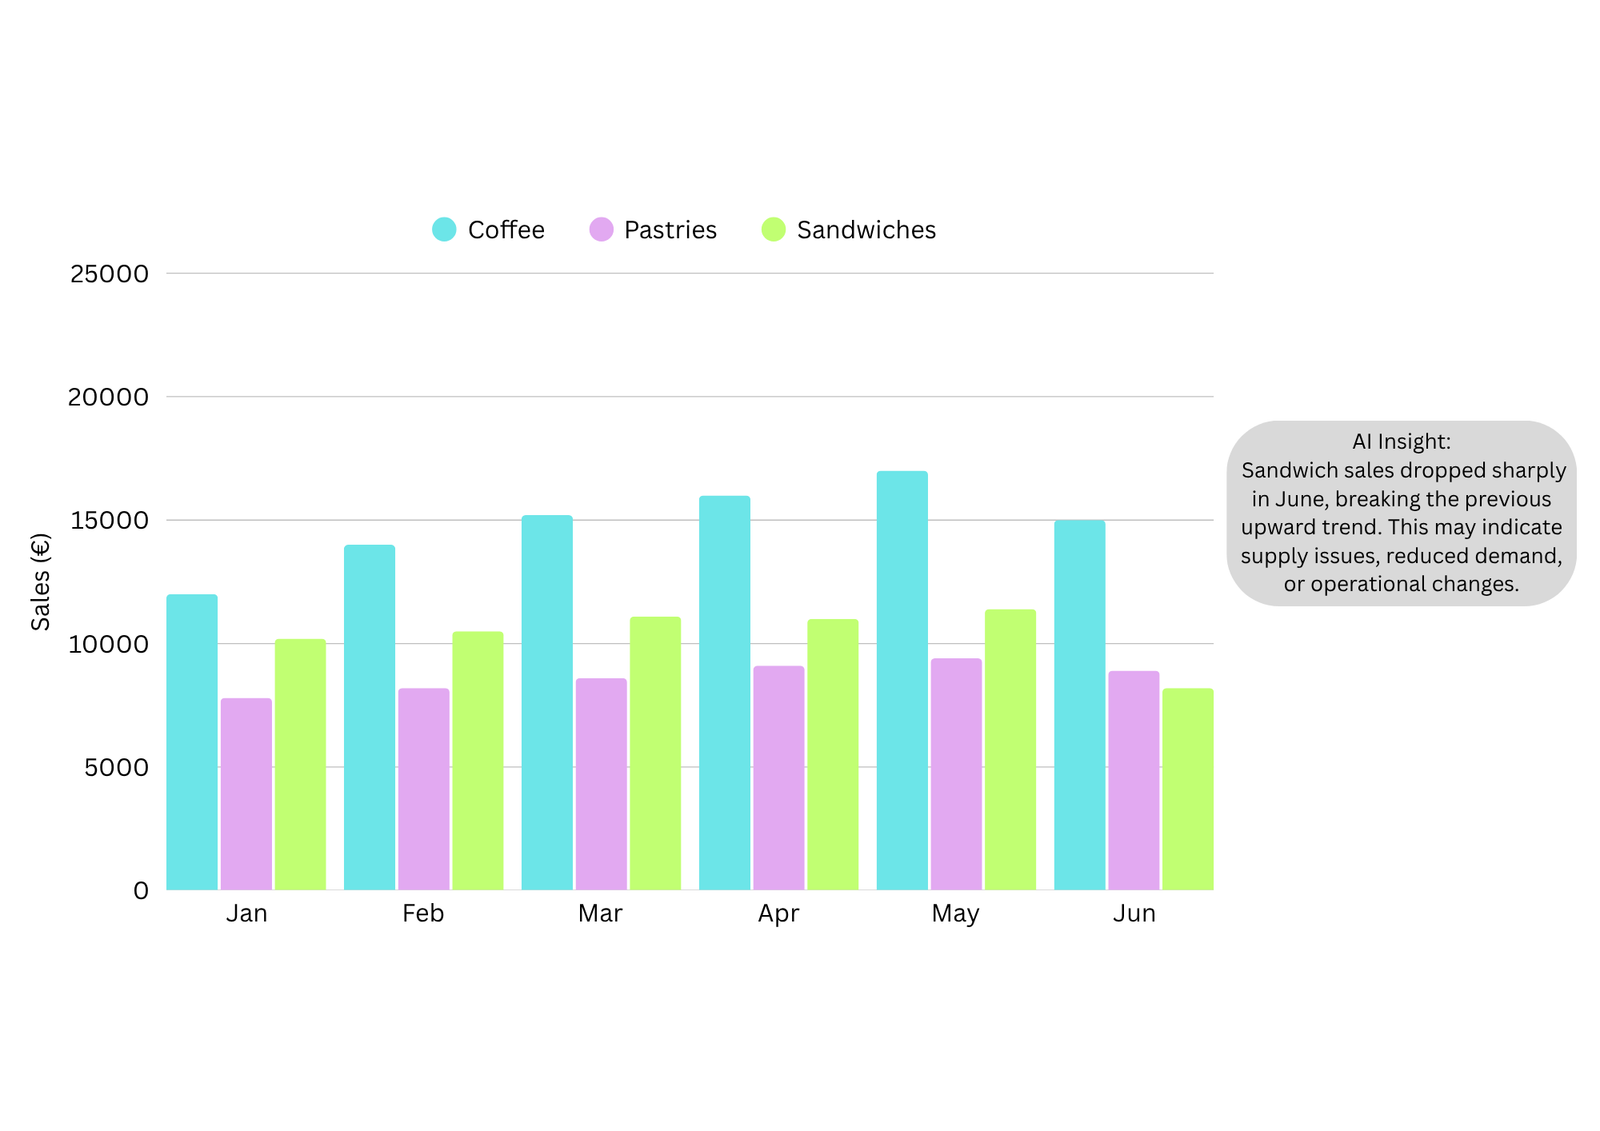
This is a grouped bar chart, which helps staff compare multiple product categories at the same time. AI systems can automatically flag:
Look at the graph and the AI Insight box, then answer the questions below:
Funded by the European Union. Views and opinions expressed are however those of the author(s) only and do not necessarily reflect those of the European Union or the European Education and Culture Executive Agency (EACEA). Neither the European Union nor EACEA can be held responsible for them. [Project number: 2024-1-AT01-KA220-VET-000245796]